→ Click here for Japanese page ←
My teacher was planning to dispose of it (?). I got a mysterious red dragon fruit called Red Pitaya. (Pitaya = Dragon Fruit) This dragon fruit is not a fruit, but a measuring instrument.
Red Pitaya is a measurement board born from crowdfunding called Kickstarter.
It is an open source measurement and control tool, and is said to be an alternative to laboratory equipment.It is also possible to easily add functions by installing a new application.Since Linux is running on the board and a web server is running on it, you can check the measurement results in real time from a web browser by accessing this web server. The size fits in the palm of your hand, and you can access and measure from other devices such as PCs and tablets anywhere. It can be said that it is a new type of measurement device that is in line with the recent trends.
This time, I would like to set up using the case of Windows as an example.
◆What is Red Pitaya?◆
Red Pitaya is an open source measuring instrument developed to replace expensive equipment.
This powerful tool is at the heart of a system that makes it easy to discover, experience, learn, develop and share different applications with Red Pitaya.

Bazaar is also an open source application with just one click. Initially the following are available:
・ Oscilloscope
・ Spectrum analyzer
・ Oscilloscope & arbitrary signal generator
Red Pitaya can be any instrument just by changing the application. It can be easily used with oscilloscopes and spectrum analyzers.

Specifications
Main specifications
analog:
・ Input channel: 2
Bandwidth: 50 MHz (DC coupled, 3 dB BW)
Sample rate: 125 Msps
ADC resolution: 14 bits (LTC ADC)
Input impedance: 1 MOhm // 10pF
Input channel gain: fixed (due to improved dynamic range) 14-bit particle size)
Default full-scale voltage: + -0.6 V (+ -6 V 10x probe attenuation). Full-scale reconfigurable by replacing discrete components (+ -15V).
Overload protection: protection diode
Connector type: SMA
・ Output channel: 2
Bandwidth: 49 MHz (3)
DC coupling in dB, 3 dB BW defined by anti-imaging filter) Sample rate: 125 Msps
DAC resolution: 14 bits
Impedance: 50 ohms
Full scale power: 10 dBm (50 ohm load)
Output slew rate: 200 V / us
Short circuit protection: Yes
Connector type: SMA
・connections: 100 Mb Ethernet, USB, USB OTG (2.0), JTAG, I2C, UART, SPI ...

◆Setup◆
①Hardware.
Reference:RedPitaya セットアップ レビュー
In Red Pitaya, Linux data etc. are stored in the Micro SD card as storage.
Use a Micro SD card that is FAT32 and does not exceed 32GB.Download the image to burn to Micro SD and unzip the downloaded Zip file.Copy all the contents of the Zip file to the SD card.
Carefully insert this Micro SD card into the Red Pitaya Micro SD card slot.
After inserting the SD card, connect the upper USB as a USB power supply of 2A or more, the lower USB as serial communication with a PC, and the LAN to an appropriate port.
This time it was not a direct connection, but I connected with a wired LAN router.
②Connect to PC.
Reference :RedPitaya セットアップ レビュー
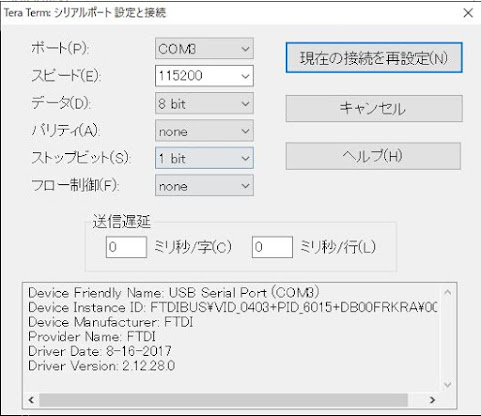
Red Pitaya can use a serial console independently of Ethernet. You can check the status at boot time and perform normal command line operations, which is convenient for verification when it does not work, although it is not essential. It is recommended to use it when it is not good like this time.
The parameters for the serial connection are as follows:
参考:Tera Term
③Power ON.
After preparing for ①, connect the USB power supply that can supply 2A and the Micro USB port for the power supply of Red Pitaya, and Red Pitaya will start. If all goes well, the blue and green LEDs on the board should light up and the orange LED0 should flash.
④Power on Red Pitaya(Tera Term)
If the connection is successful,
Red Pitaya GNU/Linux/Ecosystem version 0.92-378
redpitaya>
will be displayed on the screen.A regular Linux console is also available.
◆Try using the app◆
Initially, you can use three web applications: oscilloscope, oscilloscope & signal generator, and spectrum analyzer. To check the operation, use Generator & Oscilloscope.
Connect the probe to the IN1 and OUT1 analog terminals. Connect the probes as shown in the picture below so that you can directly input the generated waveform.
Select Generator & Oscilloscope on the app screen.
To set the oscilloscope, first click the Channel 2 button in the upper left to erase unnecessary waveforms in Channel 2. Set the Trigger setting items as Source: Channel 1, Mode: Normal, Edge: Rising, and Level: 0 V. With this, the waveform can be fixed based on the rise at 0V. If you set X axis: 2ms and Y axis: 2V in the Range setting items, you can display the waveform as shown in the screen below.
When you check the waveform, you can see that it is a square wave with a period of 1 ms. (Although the gain in the minus direction is strange.)
◆Stumbling◆
Since I considered it differently from this article, I wrote it separately.
◆From now on◆
I'm thinking of adding a protection circuit and buffer to Red Pitaya.
The steering is thought as follows.
・ The input part is undecided. (Op amp buffer and diode protection + α)
-The output part is a buffer circuit.
Since I received it with much effort, I would like to finish it so that it can be used as a substitute for the measuring instruments at home.→「VS410A,MHS-5200A-25M,8040,PicoScope2104,」


0 件のコメント:
コメントを投稿